What is descriptive statistics?
05.08.2024
Science doesn't lie, but finding the right scientific materials and quantitative indicators to test your hypothesis can be a real challenge. Use DATA SWEEP and test your hypothesis through advanced research queries across 250M+ scientific materials and 3.1M+ quantitative indicators.
If you want to start your career as a researcher, data scientist, or data analyst, you must understand the fundamentals of statistics. A good starting point is gaining a solid understanding of descriptive statistics. In the following paragraphs, you will learn the fundamentals of statistics from scratch, starting with descriptive statistics: MEAN, MEDIAN, and MODE.
Descriptive statistics refer to a collection of statistical techniques employed to succinctly describe, arrange, and show data in a coherent manner. Data summaries offer a concise presentation of the primary characteristics of a dataset, enabling researchers and analysts to comprehend patterns, trends, and distributions without making assumptions or predictions about a broader population.
Essential Elements of Descriptive Statistics
Descriptive statistics can be classified into three primary types:
- Measures of central tendency
- Measure of variability
- Frequency distribution
The measure of central tendency refers to statistical measures that provide information about the central or average value of a dataset. The prevailing measures encompass:
Mean, Median, and Mode
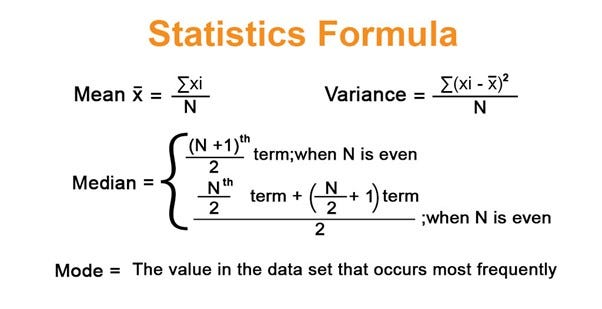
Mean: The arithmetic average of all data points. The mean is the most frequently utilized form of average, obtained by adding up all the values in a dataset and dividing the amount by the total number of values. This is commonly known as the arithmetic mean.
Example: Imagine you have the following set of numbers representing the scores of 5 students on a test: 75, 85, 90, 95, 100
Step 1: Add all the numbers together
75 + 85 + 90 + 95 + 100 = 445
Step 2: Count how many numbers are in the set:
In this case, there are 5 scores.
Step 3: Divide the sum by the number of scores
Mean = 445/5 = 89
Median: Is the central value obtained by arranging data points in ascending or descending order. The median is the value that lies in the middle of a dataset when the numbers are sorted in ascending or descending order. If the number of observations is even, the median is calculated as the arithmetic mean of the two middle numbers.
Example: Imagine you have the following set of numbers representing the ages of 7 people: 22, 34, 29, 25, 31, 28, 40
Step 1: Arrange the numbers in ascending order: 22, 25, 28, 29, 31, 34, 40
Step 2: Find the middle number: Since there are 7 numbers, the middle number is the 4th one in the sorted list; therefore, the median is 29.
Example with an even number of values: let's say you have the following set of numbers: 22, 25, 28, 31, 29, 34
Step 1: Arrange the numbers in ascending order: 22, 25, 28, 29, 31, 34
Step 2: Since there are 6 numbers (an even number), the median is the average of the two middle numbers (3rd and 4th): the two middle numbers are 28 and 29
Step 3: Calculate the average of these two numbers.
Median: (28 + 29)/2 = 28.5
Mode: The mode is the most commonly occurring value in a dataset. The mode in statistics is the value that occurs with the highest frequency in a dataset. It functions as one of the indicators of central tendency, in addition to the mean and median. The mode is applicable to both numerical and categorical data.
In the given dataset (1, 2, 2, 3, 4), the mode is 2 as it has a higher frequency of occurrence compared to the other numbers. A dataset might have several modes, depending on the frequency of occurrence of its values. It can be unimodal (having one mode), bimodal or multimodal (having more than one mode), or it may not have any mode if all values occur with equal frequency. In the above dataset (1, 1, 2, 2, 3), both the numbers 1 and 2 occur most frequently, making it a bimodal dataset.
Application of Mean, Median, and Mode in Data Analysis
Descriptive statistics encompassing the mean, median, and mode offer a thorough perspective on the data. Analysts can evaluate the measures of central tendency and variability, which helps in comprehending the distribution of data points.
Analyzing Trends: Monitoring the fluctuations in these metrics over a period of time can unveil patterns in the data. For instance, when the average income of a population is rising while the median value remains constant, it could suggest a rise in income disparity.
Decision Making: These metrics can provide valuable insights for making business decisions. For example, if a corporation aims to advertise a product based on customer satisfaction ratings, understanding the mode can assist in identifying the most frequent feedback, while the median can unveil the average client experience.
Data cleaning involves the understanding of the mean and median, which can be useful in identifying outliers that may require attention before conducting further research. If the mean is substantially greater than the median value, it could indicate the existence of extreme data points that might influence the analysis in a misleading way.
Do you want to be the first one that is going to have premium access to the DATA SWEEP Beta platform? If yes, fill out the form.
In the next blog post, we are going to talk about variability, standard deviation, range, and frequency distribution.
Article image source - towardsdatascience.com
Science doesn't lie, but finding the right scientific materials and quantitative indicators to test your hypothesis can be a real challenge. Use DATA SWEEP and test your hypothesis through advanced research queries across 250M+ scientific materials and 3.1M+ quantitative indicators.